
MTT Analytics
The Analytics page is for reviewing your MTT results using filters that let you narrow the data by site, day, time, format, and date range.
Unlike Sessions, which focuses on individual sessions, Analytics is designed to help you study patterns in your tournament results.
Choosing Sites
The Sites filter lets you choose which poker site or sites to include in the results.
You can select All Sites or choose individual sites.

Use this when you want to compare or isolate results from a particular poker site.
Filtering by Day
The Days filter lets you select one or more days of the week.
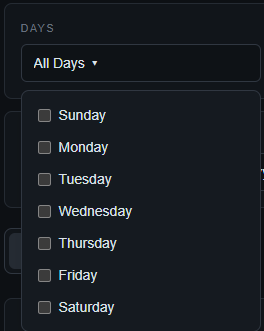
For example, selecting specific days can help you examine whether your results differ between weekdays and weekends.
Filtering by Time
The Time filter lets you examine results from different parts of your playing schedule.
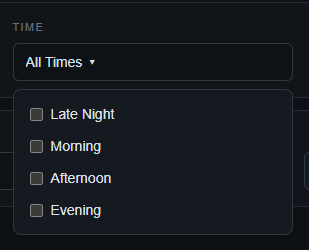
Filtering by Format
The Format filter lets you include one or more tournament formats.
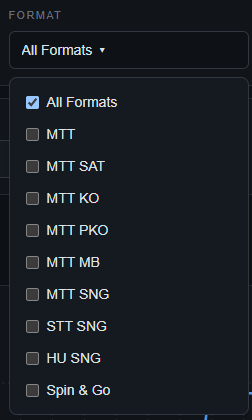
This makes it possible to isolate a particular format rather than combining different types of tournament play.
Filtering by Date
The date controls let you specify a From and To date.
You can enter a custom date range or use the preset buttons:
- MTD — month to date
- 30d — last 30 days
- 90d — last 90 days
- 1y — last year
- YTD — year to date
- Clear — remove the date range

Date filtering can be combined with the other filters. For example, you can examine a particular format at a particular site during a specific period.
Combining Filters
The filters work together. Selecting a site, day, time, format, and date range narrows the results to the tournaments matching the selected criteria.
The filter controls are independent, so you can use only the filters that are useful for the question you are trying to answer.
Profit and ROI
Analytics provides two result measures:
- Profit — review your MTT net results.
- ROI — review return on investment.

Select the measure you want to study before reviewing the chart and result table.
Reading the Results
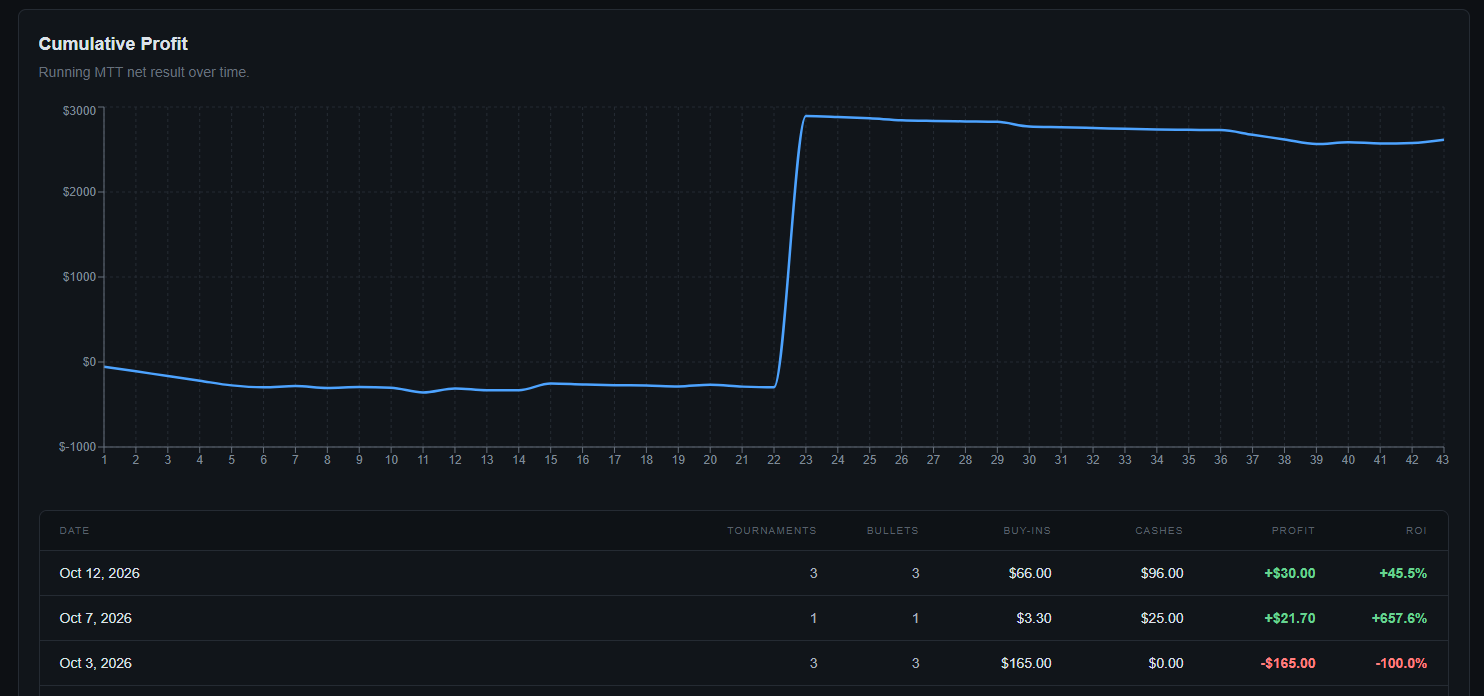
The Over Time view shows cumulative results across the selected data.
The chart displays the running result, while the table below it breaks the data down by date. The table includes:
- Date
- Tournaments
- Bullets
- Buy-ins
- Cashes
- Profit
- ROI
The result table provides the detail behind the chart. Use it to see how individual dates contributed to the overall result.
Other Result Views
Analytics also provides additional ways to group the selected results:
- Over Time
- By Site
- By Format
- By Buy-In
These views let you look at the same filtered results from different perspectives.
A Practical Workflow
When reviewing your tournament results:
- Start with the date range you want to study.
- Add a site filter if you want to isolate a particular poker site.
- Add day or time filters when you want to study your playing schedule.
- Add a format filter when you want to isolate a particular type of tournament.
- Choose Profit or ROI.
- Review the chart and table.
- Try the By Site, By Format, or By Buy-In views when you want to see where the results are coming from.
Tip: Start broad, then narrow the filters. This makes it easier to see how a particular site, format, day, time period, or buy-in affects your overall MTT results.