
Cash Analytics
Cash Analytics is used to review cash-game results across sessions and identify how performance changes by site, game, stakes, table size, time, and other filters.
The page combines filters, summary statistics, and charts so you can narrow the results to the games or situations you want to examine.
Filters
Cash Analytics provides filters for:
- Sites — limit results to one or more poker sites.
- Games — limit results to a game type such as NLHE, PLO, PLO5, PLO6, or PLO8.
- Days — limit results to particular days of the week.
- Time — limit results to a time-of-day category.
- Table Size — limit results to a specific table size.
- From / To — choose a specific date range.
- Mtd / 30d / 90d / 1y / YTD — apply common date ranges quickly.
- Clear — remove the current date-range selection.
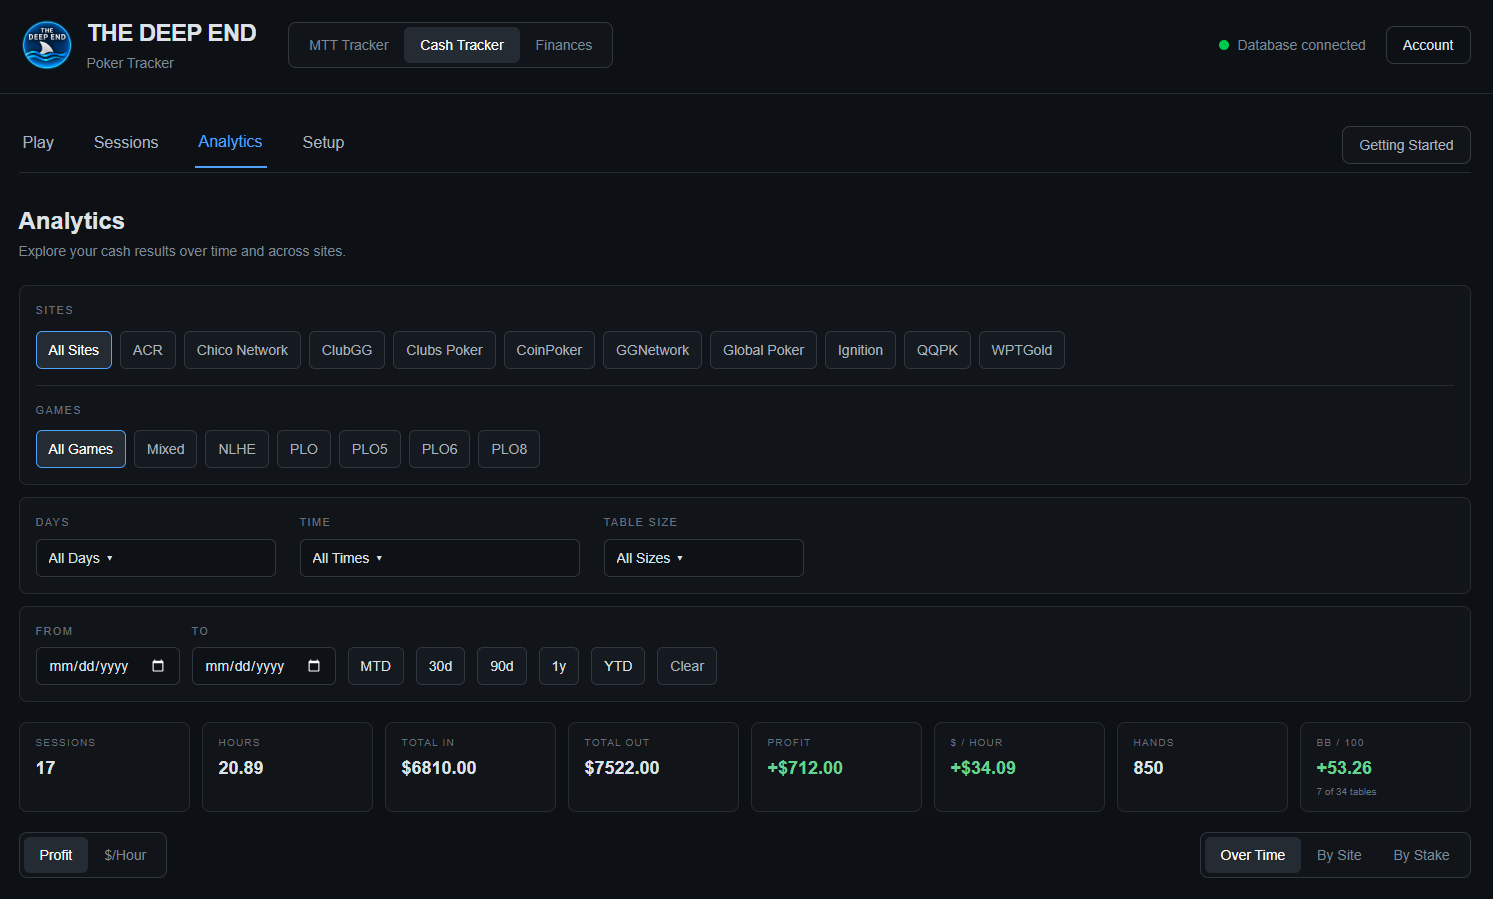
Filters can be combined. For example, you can narrow the results to a particular site, game, stakes, and table size rather than looking at your entire cash history.
Sites and Games
The Sites filter lets you compare or isolate results by poker site.
The Games filter separates game types. This is useful when your cash results include more than one game, such as NLHE and PLO variants.
These filters affect the summary numbers and results displayed below them.
Days and Time
The Days filter lets you select specific days of the week.
The Time filter groups sessions by time of day. Use it when you want to examine whether your results differ between different parts of the day.
Table Size
The Table Size filter lets you isolate results by the recorded table size.
For example, selecting 6-max shows only sessions/tables recorded as 6-max.
Important: Table-size analysis depends on the session having a table size recorded. Older sessions created before table-size tracking was added may have no table size. Those sessions will need to be edited before they can be included accurately in a table-size-specific filter.
Date Ranges
Use From and To to define a custom date range.
The shortcut buttons provide common ranges:
- MTD — month to date
- 30d — last 30 days
- 90d — last 90 days
- 1y — last year
- YTD — year to date
Use Clear to remove the selected date range.
Reading the Summary
The summary cards show the results for the currently selected filters.
They include:
- Sessions — number of cash sessions included.
- Hours — total playing time represented by those sessions.
- Total In — total money put into the included sessions/tables.
- Total Out — total money cashed out.
- Profit — Total Out minus Total In.
- $/Hour — profit divided by hours played.
- Hands — total recorded hands played.
- BB / 100 — big blinds won or lost per 100 hands when sufficient blind and hand data is available.
The numbers update as filters are changed, allowing you to compare different portions of your cash-game history.
Hands
The Hands value is the total number of hands recorded for the filtered results.
Hands must be entered for the sessions/tables in order for the tracker to calculate hand-based statistics.
A session can therefore contribute to the dollar-based results without contributing hands to the hand-based calculations if its hand count has not been recorded.
BB / 100
BB / 100 expresses your cash-game result in big blinds won or lost per 100 hands.
This provides a stake-independent way to evaluate cash-game performance. For example, a positive BB/100 means you are winning big blinds at that rate over the recorded hands.
The tracker can only calculate this meaningfully when the relevant blind structure and hand counts are available.
The card also indicates how much of the available table data is covered by the BB/100 calculation.

Profit vs. $/Hour
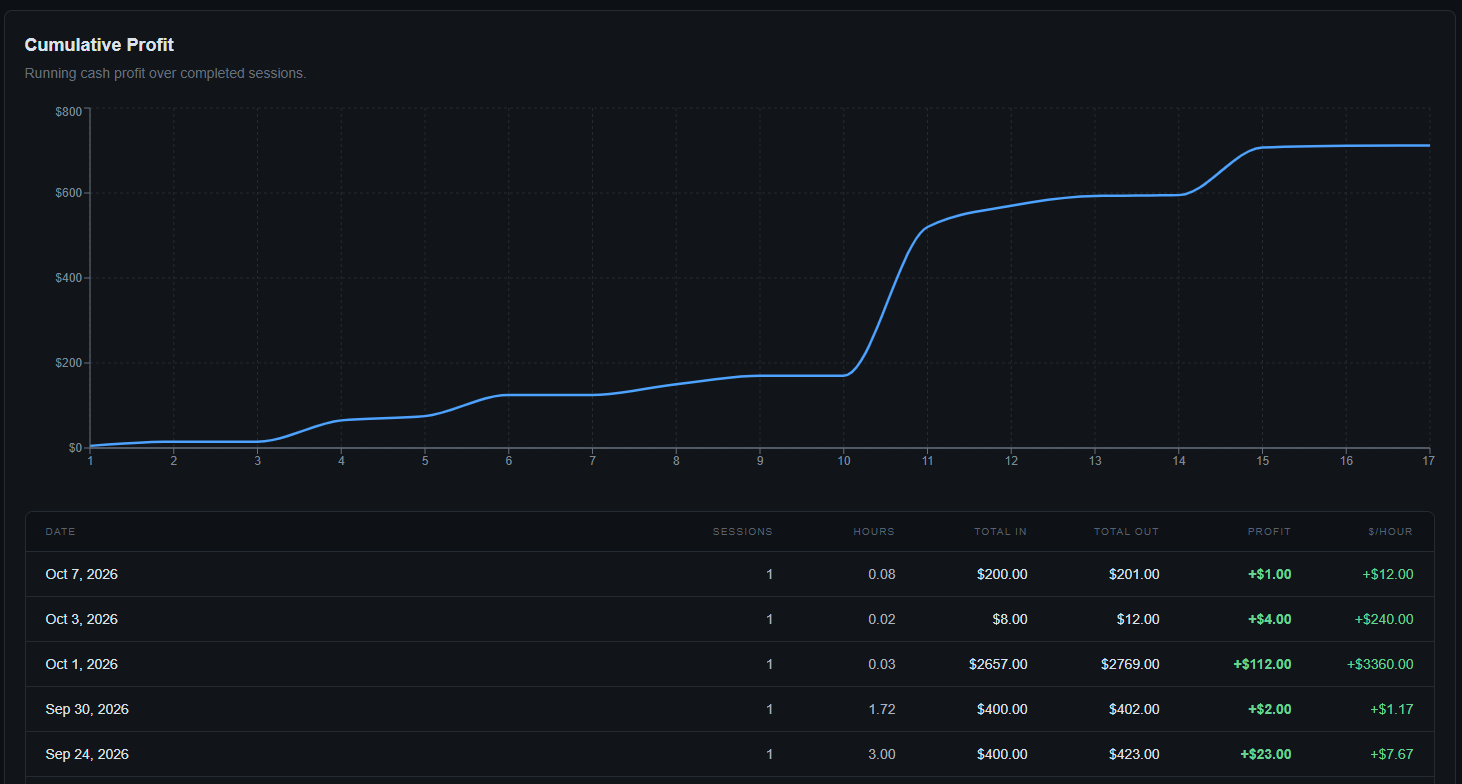
The chart controls let you switch between Profit and $/Hour.
- Profit shows the dollar result.
- $/Hour shows the hourly result.
The grouping controls let you view results:
- Over Time — see how results change across sessions/dates.
- By Site — compare results by poker site.
- By Stake — compare results by stakes.
Use these views together with the filters to answer more specific questions about your cash play.
Reading the Results
Cash Analytics is most useful when you ask a specific question and then use the filters to isolate the relevant data.
Examples:
- How am I doing at one particular site?
- How does PLO compare with NLHE?
- How am I performing at 6-max?
- Am I playing better or worse at different times of day?
- What is my profit and $/hour at a particular stake?
- What is my BB/100 when looking only at a particular game or table size?
Start with broad results, then add filters one at a time. This makes it easier to see what is actually driving a change in the numbers.
Tip: Dollar profit, $/hour, and BB/100 answer different questions. Profit tells you how much money you made or lost, $/hour accounts for the time spent playing, and BB/100 measures performance in big blinds per 100 hands.